For the past few weeks we’ve been very busy here at Neurobat with the analysis of field tests results. In the process of doing that, we had to implement several functions in R that relate to building physics.
We thought it might be useful for the community to have access to those functions, so we decided to begin submitting them to CRAN. That’s why we’re pleased to announce the first release of the homeR package, which we will fill over time with such functions.
This first release, version 0.1, contains just pmv, a function to calculate the so-called Predicted Mean Vote, i.e. a measure from -3 (cold) to +3 (hot) of thermal comfort as a function of several variables, including air temperature, clothing and metabolism.
Here I show how with this function one can derive a contour plot showing, for given clothing and metabolism, the optimal indoor temperature (assuming 50% relative humidity). We’re basically going to solve the pmv(clo, met, temp, sat) = 0 equation for temp across a grid of clo and met values with the uniroot function.
clo <- seq(0, 2, length = 21)
met <- seq(0.6, 3.2, length = 21)

zero.pmv <- function(clo, met) {
  uniroot(function(temp) pmv(clo, met, temp, 50), c(-10, 40))$root
}

contourplot(
  outer(clo, met, Vectorize(zero.pmv)),
  cuts = 20,
  aspect = "fill",
  panel = function(...) {
    panel.grid(h = -1, v = -1, ...)
    panel.contourplot(...)
  },
  row.values = clo,
  column.values = met,
  xlim = extendrange(clo),
  ylim = extendrange(met),
  xlab = "[Clo]",
  ylab = "[Met]"
)
And here is the resulting plot:
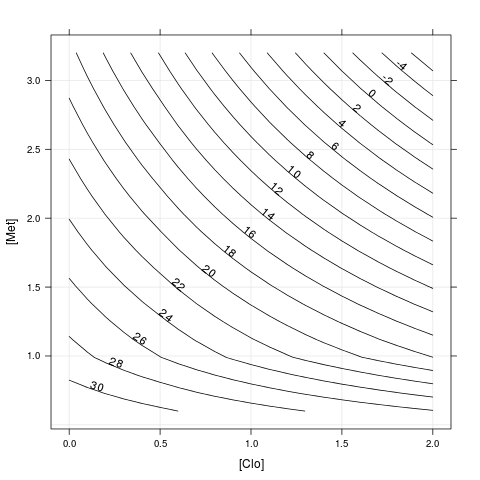
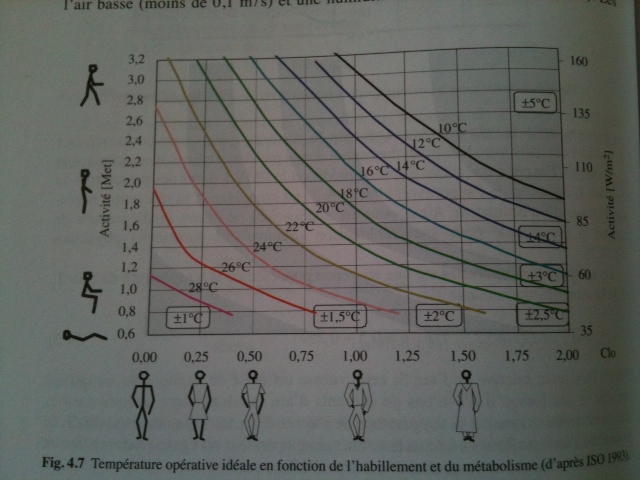
As you can see, this is pretty similar to that sort of plots one finds in standard textbooks on the subject, such as Claude-Alain Roulet’s Santé et qualité de l’environnement intérieur dans les bâtiments:
Please give the homeR package a try, and give us your feedback. There’s only the pmv function in there at the time of writing but we plan to extend the package in the weeks to come.